
Statistics: the hours and costs behind every vineyard
Vinitor works out where your hours and your money go — per employee, per vineyard and per task type. Working times, staff and equipment costs, total costs and the distribution of your tasks, all from the data your team records anyway. The analysis happens in the dashboard.
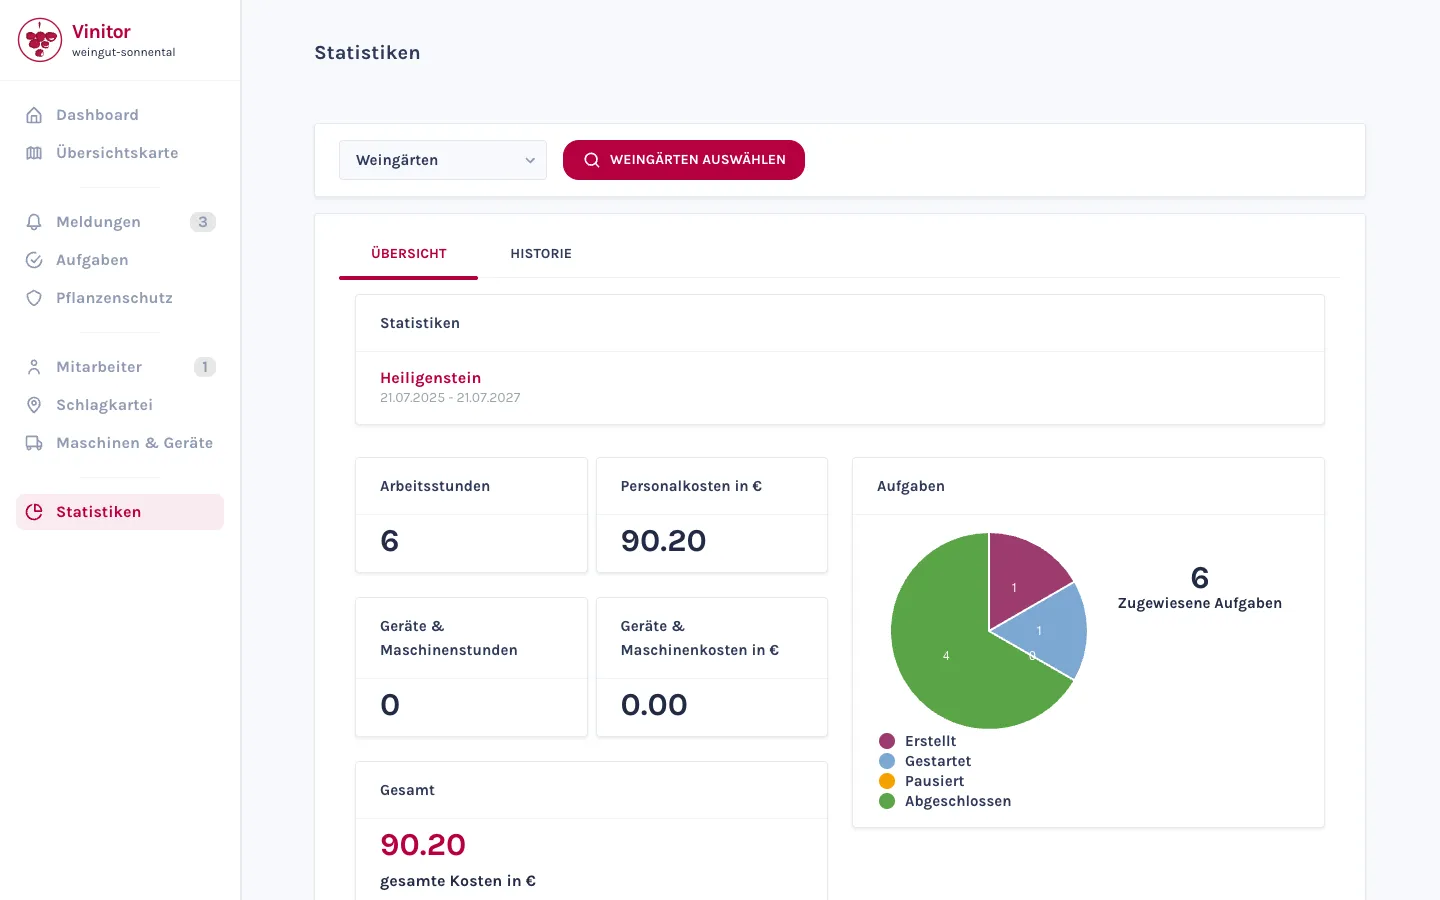
Three perspectives: employee, vineyard, task type
You choose what you want to analyse — an employee, one or more vineyards, or a task type. What gets analysed is always the same: working times, costs and tasks. As soon as you change the selection, the analysis reloads on its own — you don't need to confirm anything.
- For vineyards, you can also select several at once, or a whole vineyard group.
- Your last selection is there again the next time you open it — it stays saved.
- The period can be freely chosen; without a selection, you see the entire period.
Working times and staff costs
Vinitor totals the recorded working hours for the chosen period and calculates the staff costs alongside them — from the hours and the salaries and working-time models on file for your employees. Plus the working days: the number of calendar days on which any work took place at all.
- Working hours, totalled from the recorded working times for the period.
- Staff costs in euros — from the hours and the salaries of your employees.
- For the employee view, additionally: the task type with the most hours, plus working and leave days.
Costs per vineyard: equipment, machinery, total costs
If you analyse by vineyard or task type, the equipment and machinery costs flow in too — not just staff costs. At the end, you get the total-cost view: staff, equipment and cost-relevant fields in one sum. So you see what a vineyard or a job really costs.
- Equipment and machinery hours, along with their costs, feed into the analysis.
- Total costs in one figure: staff costs plus equipment costs plus cost-relevant task fields.
- Analyse several vineyards or a vineyard group together — costs per vineyard instead of just for the whole winery.
Tasks, status and custom fields
Besides time and money, Vinitor also analyses the work itself. Task status is shown as a pie chart — created, started, paused, completed — and one click opens the list behind it. Vinitor totals up your custom task fields, and at the task type level, you see at a glance how many deadlines were missed.
- Status distribution as a pie chart: created, started, paused, completed — clickable through to the task list.
- Custom task fields are totalled per vineyard and task type — sum, average and count.
- Missed deadlines per task type, plus a history tab with all completed tasks by date.
You do the analysis in the dashboard
Statistics is only available in the dashboard — not in the mobile app. On the phone, your team records working times, tasks and reports; the analysis then happens at the desk, on the big screen.
That's deliberate: columns of figures, pie charts and cost totals aren't something you read on a phone. The app is for entering data, the dashboard is for analysing it.
Frequently asked questions
Do I see costs per vineyard?
Can I view statistics on my phone?
Where do the staff costs come from?
What period is the analysis based on?
What does it cost?
Price at 20 ha of vine area, excl. USt., cancel any time, no minimum fee — calculate for your area →
The easiest thing is to just try it.
The free tier stays free — add modules when you need them.
Even more detail — field tables, permissions, step-by-step guides — is in the documentation:Statistics in the documentation →