
Damage Reports: from a photo in the vineyard to a completed task
An employee spots damage in the vineyard — a leaking drip irrigation line, game damage, a snapped post — and reports it from the app: with photo, video and position. In the office, the report appears in the dashboard, located at the right vineyard, and becomes a task with one click. Nothing gets lost between the vineyard and the desk.
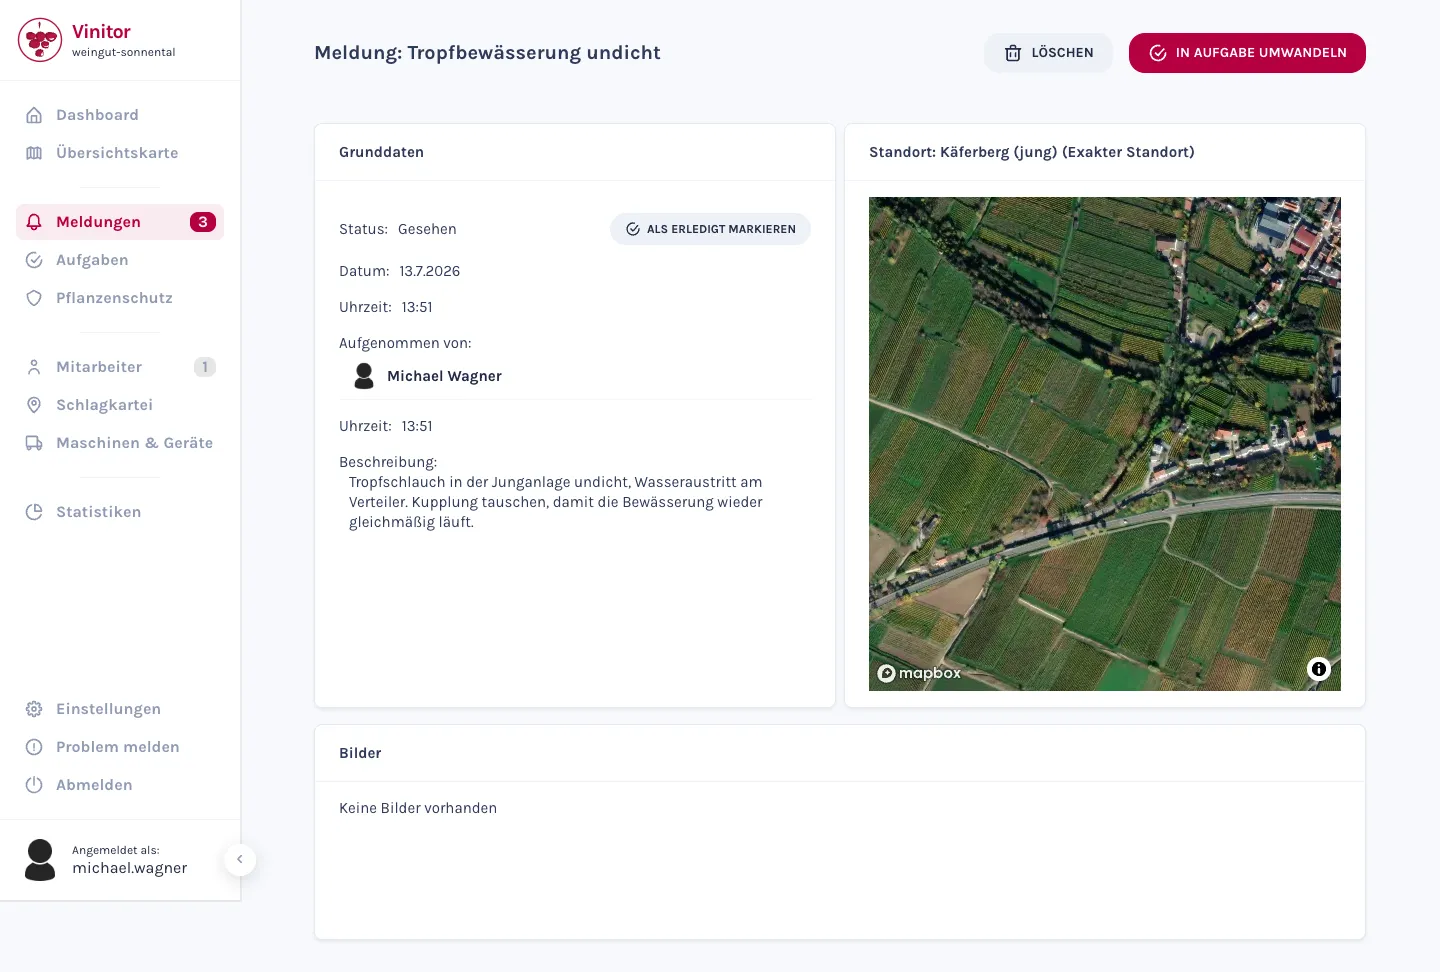
Report from the vineyard — with photo, video and position
If your team spots something in the vineyard — damage, a diseased vine, a broken pipe — it becomes a report in the app. A title as free text or from your report types, plus a description, photos or videos and the position. Done, submitted.
- Type a title freely or choose from your report types — plus a description.
- Attach photos and videos directly — automatically compressed before upload.
- Position via GPS or by selecting the vineyard — every report is located.
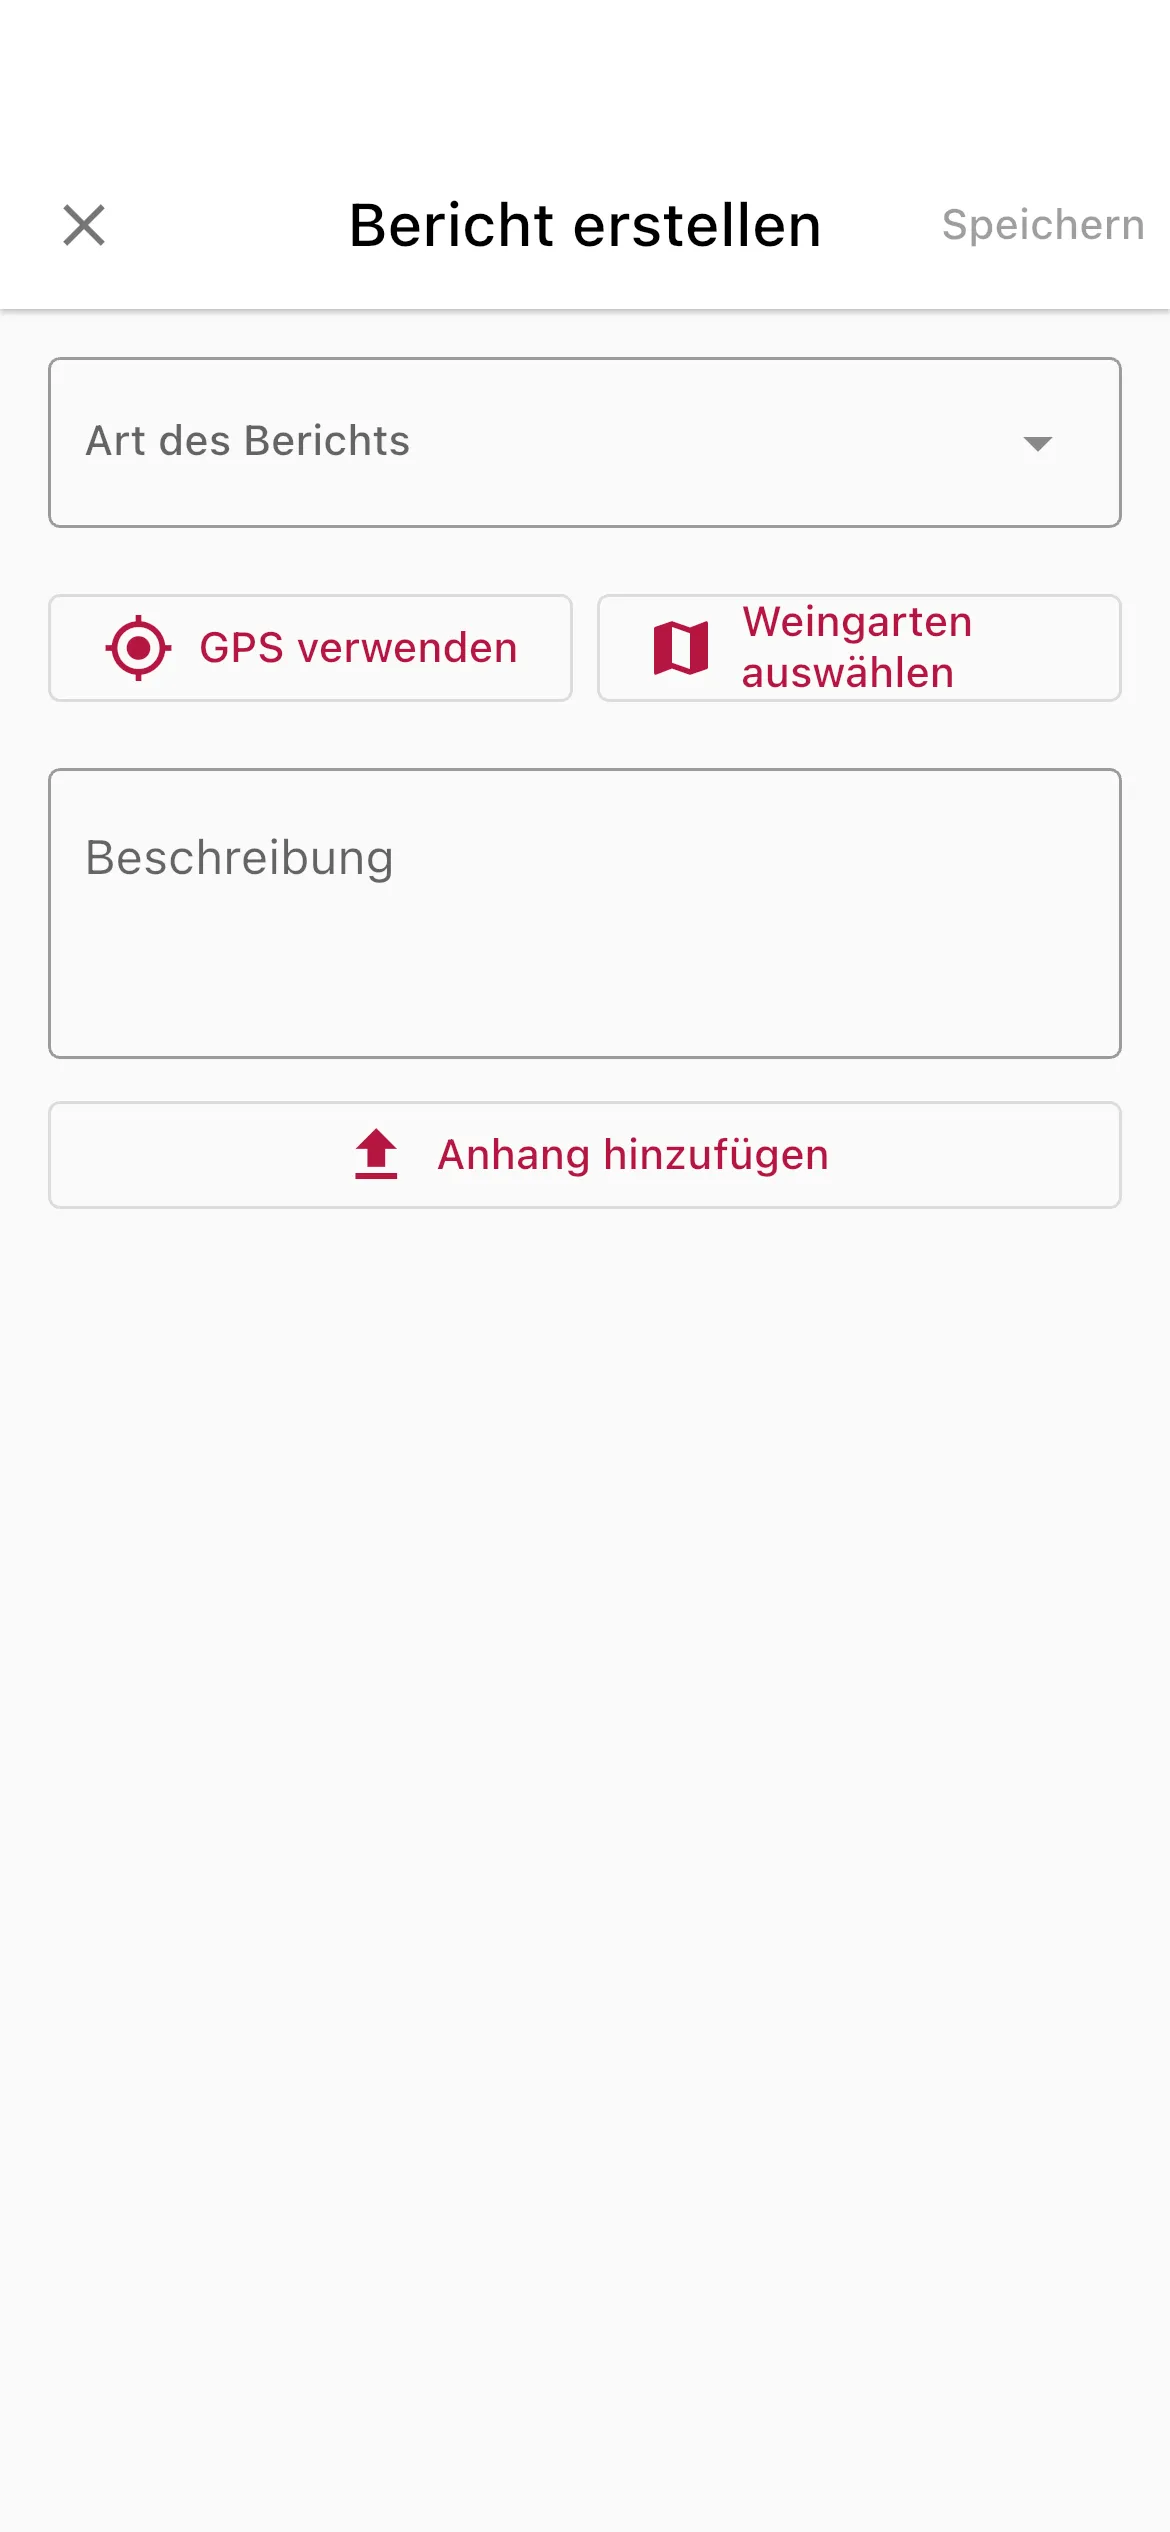
Vinitor knows which vineyard the damage is in
You don't need to look up the vineyard yourself. If you just send the GPS position, Vinitor recognises which of your vineyards the point falls in and attaches the report there. In the dashboard, you see the exact spot on the map for every report — with a marker and the vineyard's name.
- From the GPS position, Vinitor automatically matches the report to the right vineyard.
- The exact spot as a marker on the map — including the vineyard name in the report.
- You can also choose the vineyard yourself — automatic matching kicks in when only the position is sent.
From reporting to resolving — or straight to a task
Every report goes through three states: New, Seen, Resolved. When you open a new report in the dashboard, it automatically jumps to “Seen” — your team sees that it has arrived. One click on “Mark as resolved” closes it. Or you turn it straight into a task: “Convert to task” hands the report and its data over to task creation.
- Three statuses — New, Seen, Resolved — with filtering and sorting in the dashboard.
- “Seen” is set automatically as soon as you open a new report.
- “Convert to task”: the report becomes a task with its data in one click.
Review, analyse and export in the dashboard
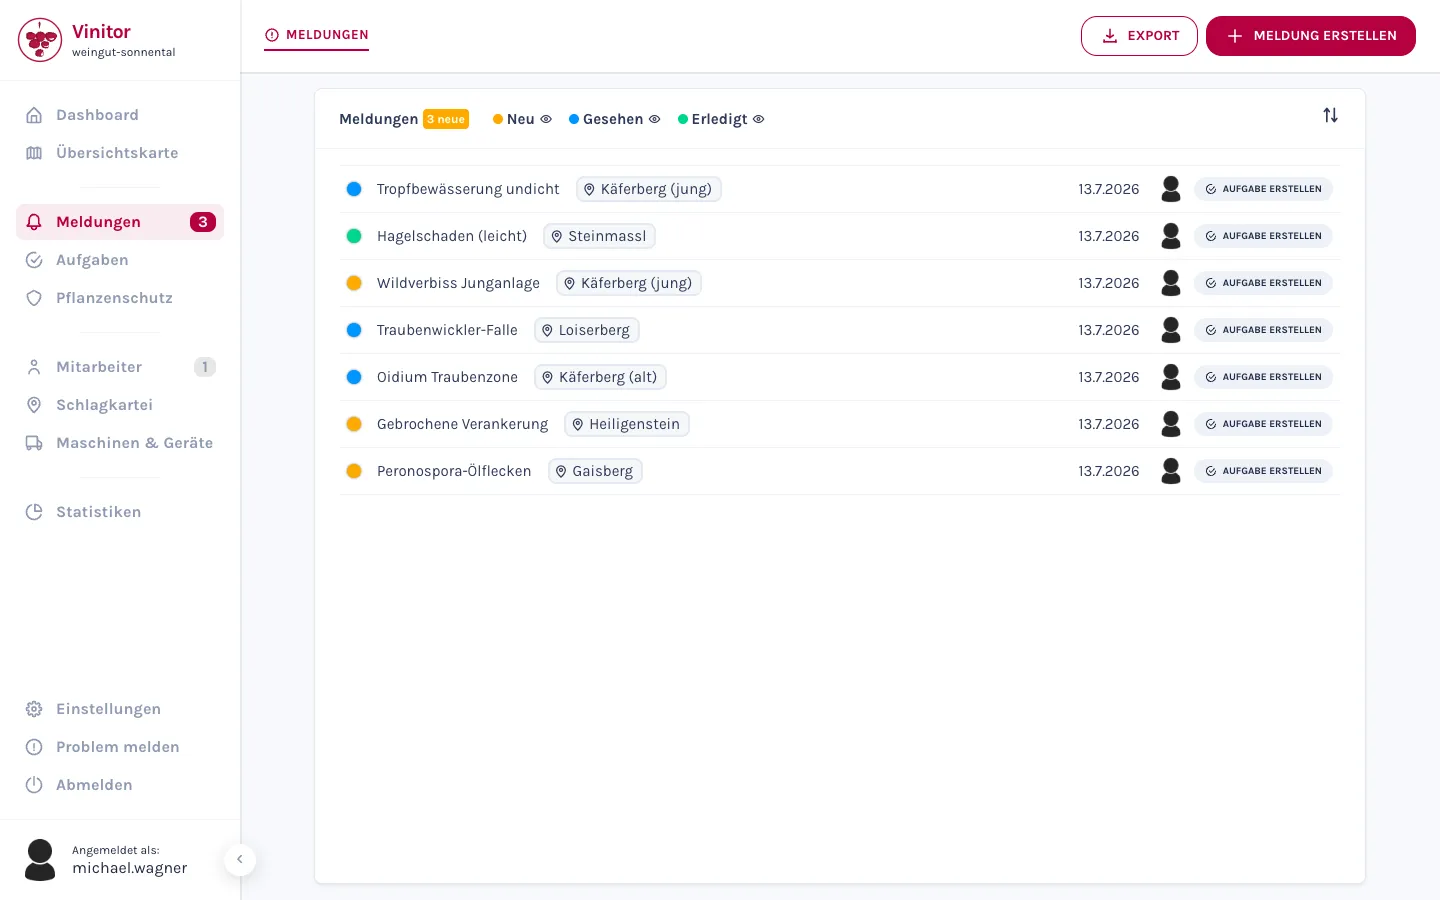
All reports come together in the dashboard — newest first, with a counter for new ones. You filter by status, sort by date or employee, and show only your own if needed. You decide which report types exist. And if you need the reports on paper or in Excel, you export the chosen period as PDF or CSV.
- Report list with status filter (New / Seen / Resolved), sorting and a counter for new reports.
- Create, rename and delete your own report types — to match your business.
- Export as PDF or CSV with type, title, date, status, creator, handler and description — plus totals (Total, Open, In Progress, Completed).
Frequently asked questions
Can I attach photos and videos?
Does Vinitor recognise which vineyard the damage is in?
How does a report become a task?
Can I export reports?
What does it cost?
Price at 20 ha of vine area, excl. USt., cancel any time, no minimum fee — calculate for your area →
The easiest thing is to just try it.
The free tier stays free — add modules when you need them.
Even more detail — field tables, permissions, step-by-step guides — is in the documentation:Damage reports in the documentation →