
Overview Map: every vineyard, colour-coded by work status
All your vineyards on one satellite map — as polygons, automatically colour-coded by the status of your tasks. Show damage reports, find any single one via search, and handle several vineyards at once with multi-selection. So you see at a glance where work is happening and where something's still outstanding.
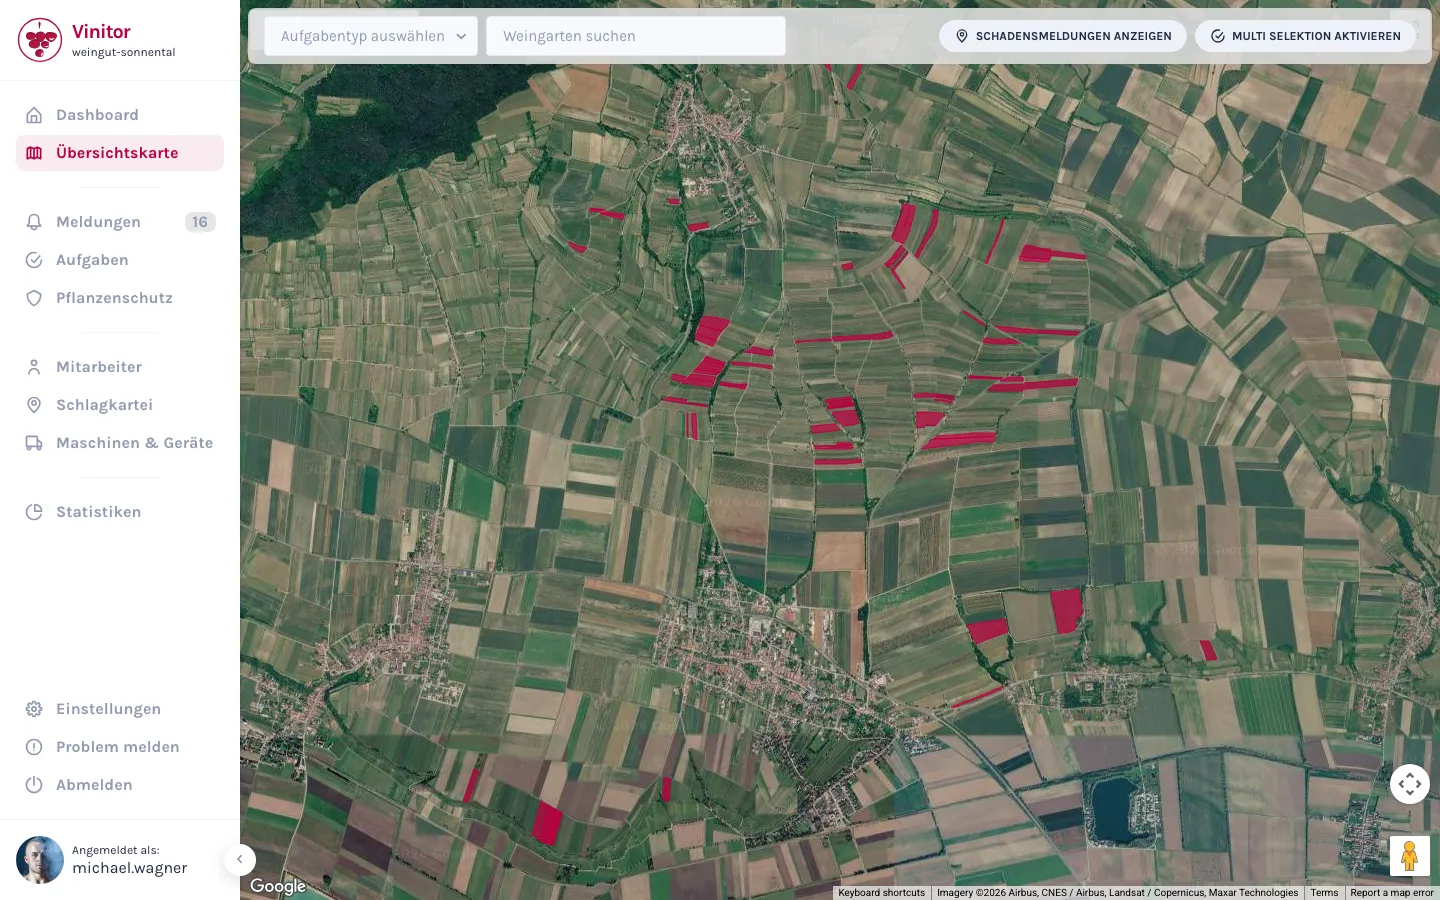
Your whole business on one satellite map
The overview map fills the whole screen: a satellite image on which every vineyard from your field record book sits as a polygon in its true shape and location. No scrolling through lists — you see your business exactly as it lies on the ground. Click an area and the vineyard opens with its details.
- All vineyards as true-to-scale polygons on the satellite image — exactly where they are.
- Click a polygon and the vineyard opens with its master data and details.
- Toolbar always in view: task type, search, damage reports and multi-selection.
Colour-coded by task status
Choose a task type at the top — leaf work or pruning, say — and the map colours every vineyard by the status of exactly that job. A legend tells you which colour means which status. So you can tell in a second where work has already happened and where nothing has happened yet.
- Choose a task type from the dropdown — the vineyards colour themselves by that task's status.
- From created through started and paused to completed — every status has its colour.
- Without a selection, the map simply shows all the areas in your business.
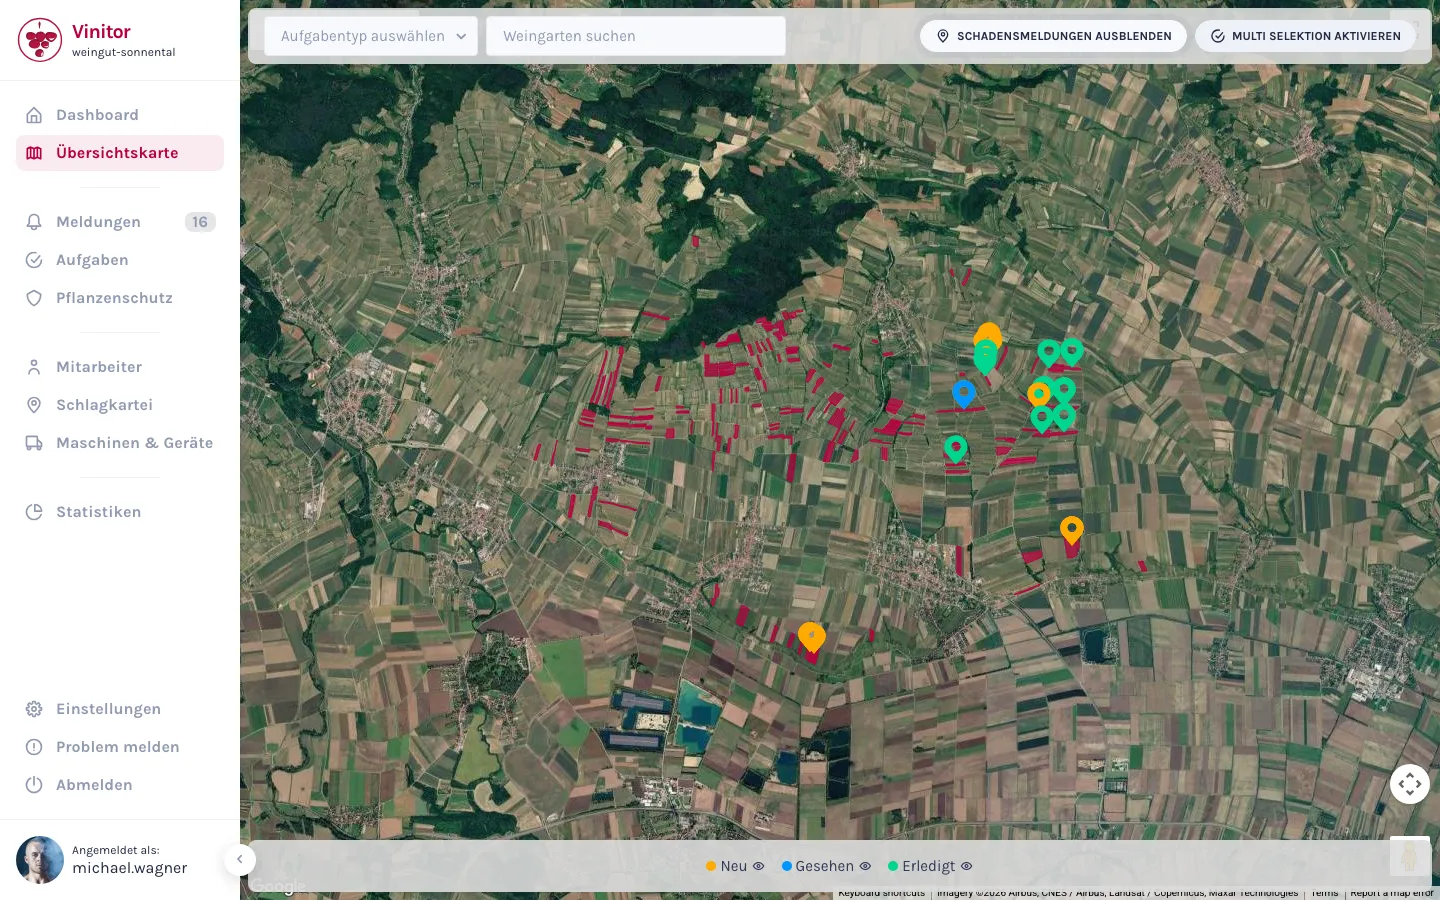
Damage reports on the map
Switch on damage reports with one click, and every report appears as a marker exactly at its position. The marker's colour shows the status — from newly reported to resolved. Click the marker to open the report in detail.
- Show and hide damage reports with a toggle — the map otherwise stays uncluttered.
- Markers by status: sent, seen and closed can each be filtered individually.
- Click a marker to open the report in detail.
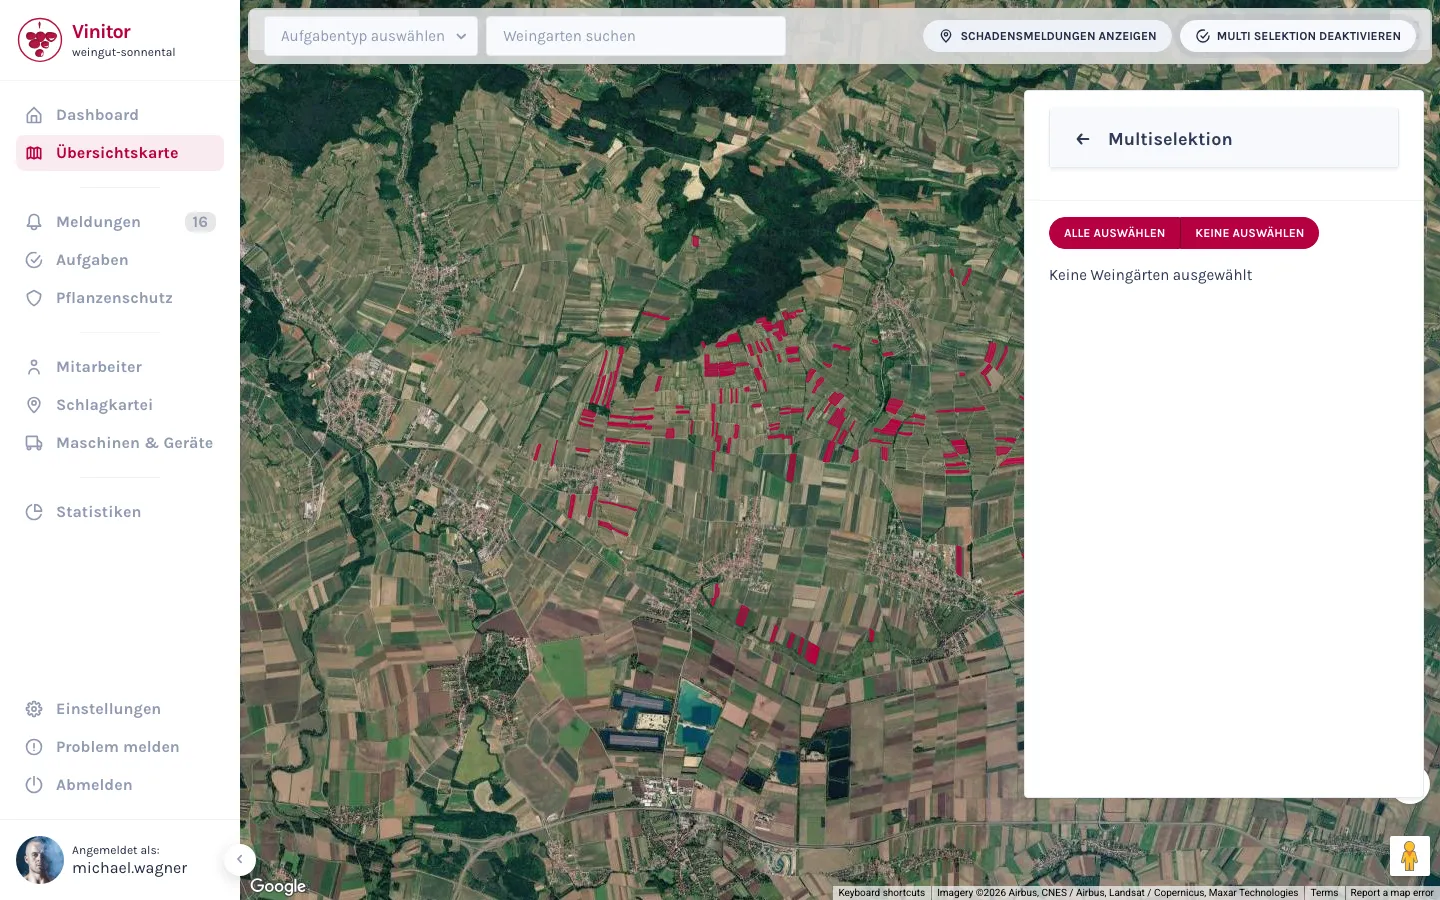
Multi-selection: many vineyards, one action
Activate multi-selection and click the vineyards you want to work on together — or select all of them in one go. From the selection, you create tasks for all vineyards at once, or group them together. What you'd otherwise do vineyard by vineyard, you handle here in one step.
- Activate multi-selection, click vineyards on the map — or select all at once and deselect individually.
- Create tasks: the selected vineyards are already filled in on the new task.
- Create group: the selection becomes a vineyard group you can reuse anywhere.
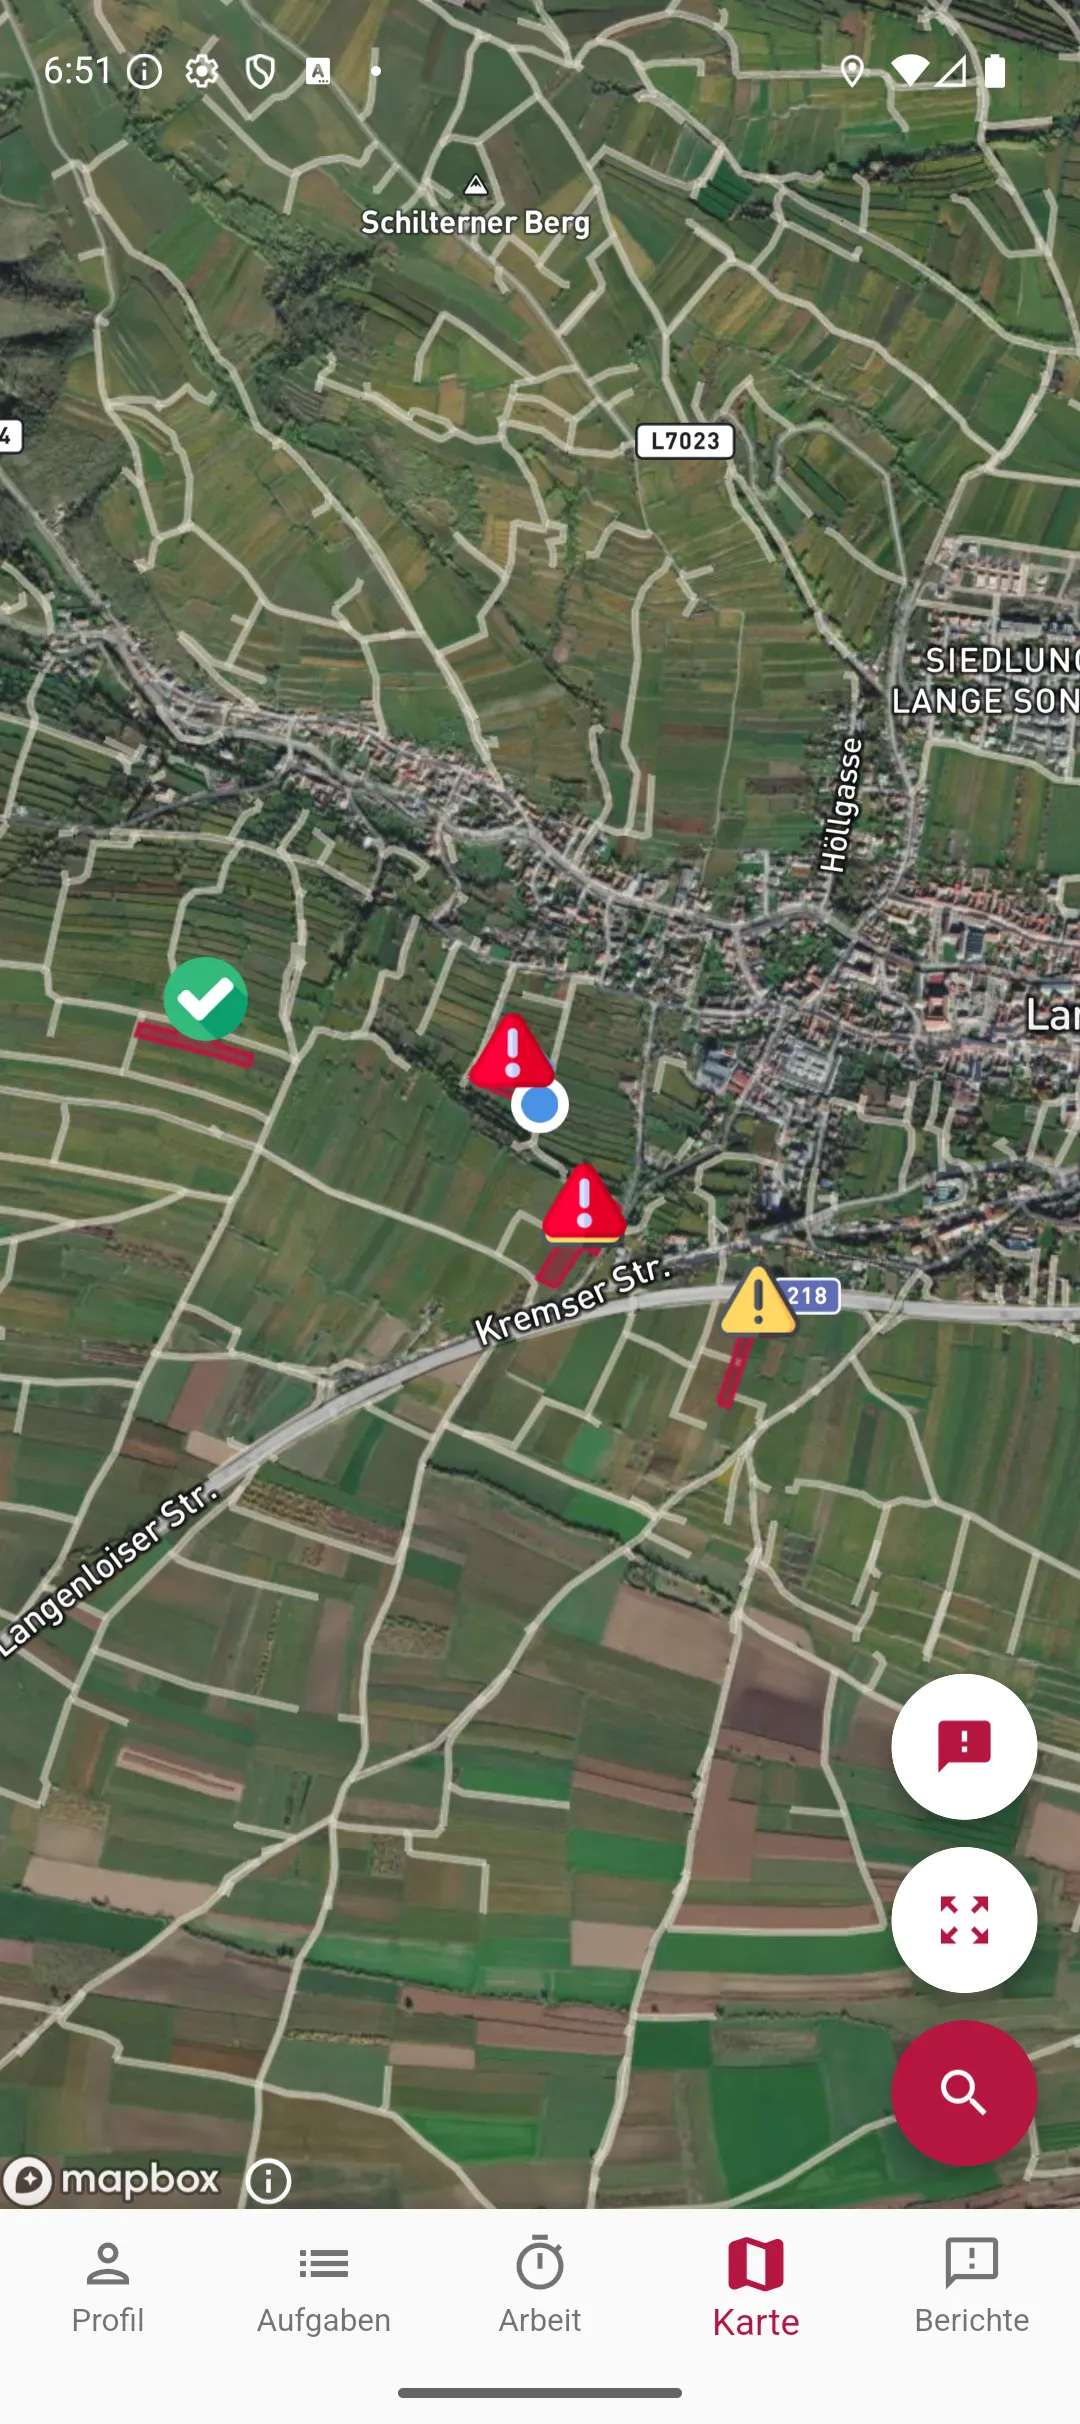
Search jump and saved view
Type a vineyard name into the search, and Vinitor highlights it on the map — in the mobile app, the search also drops a marker and jumps straight there. And the map remembers how you set it up: task type, whether damage reports are shown, and your status filters are exactly as they were the next time you open it.
- Vineyard search by name — in the app also by grape variety and vineyard number.
- In the app, the search drops a marker at the vineyard and jumps the map straight there.
- Task type, report display and status filters stay saved — even the next time you open the map.
Frequently asked questions
Can I create tasks directly from the map?
Do I see damage reports on the map?
How can I tell where work has already been done?
Does my view stay saved when I reopen the map?
What does it cost?
Price at 20 ha of vine area, excl. USt., cancel any time, no minimum fee — calculate for your area →
The easiest thing is to just try it.
The free tier stays free — add modules when you need them.
Even more detail — field tables, permissions, step-by-step guides — is in the documentation:Overview map in the documentation →